Suppose you give a person the problem of saving everyone on the Titanic. Instead of just counting final solutions, is there a more fine-grained way to measure the quantity, diversity, and uniqueness of ideas as the solver tries to create full solutions?
BrainSwarming graphs are ideal for just this quantitative, fine-grained measurement.
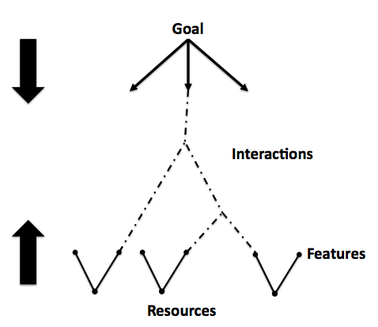
A BrainSwarming breaks innovative thinking into four main components. As the figure below shows, the goal is placed at the top and refined sub-goals grow downward. Resources are placed at the bottom and their features extend upward as signified by solid lines. Resources are interacted together, as signified by dotted lines, to produce effects that may contribute to a solution. When the top-down network connects with the bottom-up network, then a candidate solution arises.
BrainSwarming graphs are ideal for just this quantitative, fine-grained measurement.
A BrainSwarming breaks innovative thinking into four main components. As the figure below shows, the goal is placed at the top and refined sub-goals grow downward. Resources are placed at the bottom and their features extend upward as signified by solid lines. Resources are interacted together, as signified by dotted lines, to produce effects that may contribute to a solution. When the top-down network connects with the bottom-up network, then a candidate solution arises.
Based on the BrainSwarm graph, there are initially 5 types of things that can be counted: (1) the number of sub-goals that refine the main goal, resources across the bottom, the features that each resources is decomposed into, the number of interactions among the resources, as well as the number of full solution paths that were devised. These five measures (and others) together constitute a Creativity Quotient (CQ).
A Profile of Creative Strengths and Weaknesses
People could be strong on some of these measures and weak on others. For example, a person might be good at noticing many resources that others overlook, but be weak at interacting them together to form a solution path. Once a person's strengths and weaknesses are uncovered, the person could then work on their weaknesses to improve their overall CQ.
Example: Save Everyone on the Titanic
Suppose a person is given all the facts about the Titanic collision and their problem solving activity was diagrammed into the following BrainSwarming graph.
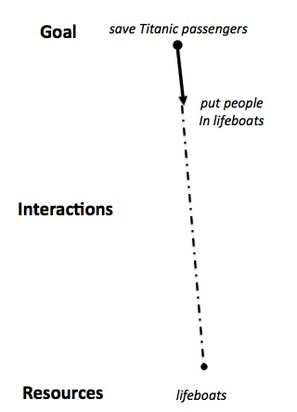
The person thinks of only one solution, put people in lifeboats, which leaves 1,500 people without lifeboats to die in the icy North Atlantic waters.
Quantitatively, this person created only one way to phrase the goal (put people in lifeboats), one resource (lifeboats), and one partial solution.
Suppose another person works on the problem and produces the following BrainSwarming graph.
Quantitatively, this person created only one way to phrase the goal (put people in lifeboats), one resource (lifeboats), and one partial solution.
Suppose another person works on the problem and produces the following BrainSwarming graph.
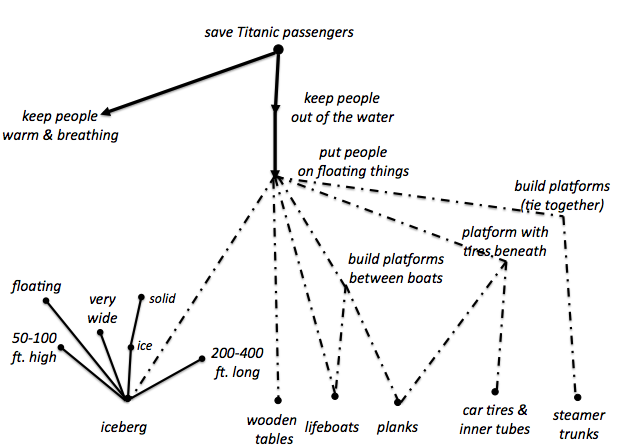
Quantitatively, this person created three ways to phrase the goal, six resources, six features of one of the resources, six interactions, and six solutions that together might save all the passengers.
Before looking at the solutions from this graph, notice that BrainSwarming graph provides five quantifiable measures as opposed to just measuring one: the number of complete solutions.
The iceberg is listed as a resource and decomposed into features and those solid lines grow upward. The listed features help reveal that the iceberg is a floating surface that, based on eyewitness accounts, was about 50-100 feet out of the water and 200-400 feet long. Possibly, lifeboats could have ferried people back to it to look for flat spots that would keep people out of the water until help arrived. Or, less likely, since Titanic was navigable for 20 minutes after the collision, perhaps Titanic could have navigated besides the iceberg so that people could have climbed directly onto it.
Wooden tables and wooden boards from the palacial dining room might have been used to span between two lifeboats creating a new surface between them that could support people.
Many passengers brought their belongings onboard in steamer trunks. Empty the trunks and close them tight, so they will float. Tie many of them together to create a floating surface. If too unsteady, lay wooden boards across them to make what people stand on more sturdy.
Rubber tires and inner tubes. It is estimated that up to 40 cars were in storage. That means at least 160 rubber tire and 160 inner tubes--not counting spare tires. Again, fastening together the rubber tires and inner tubes in larger round or rectangular shapes could have provided a floating foundation upon which to place boards.
Conclusion
The BrainSwarming graph is a strong candidate for quantifying innovative thinking. It breaks innovative problem solving into five components to measure: subgoals, resources, features, interactions, and full solutions. Counting all these quantities (and perhaps others) creates a profile of the strengths and weaknesses of the innovative thinker. I propose these measures as one form of a Creativity Quotient (CQ).
 RSS Feed
