Aha Universe
Follow me on Twitter
  • Blog
  • About
  • Contact

Creative Machines Must Complement Humans, Not Imitate Them

12/17/2014

 
Creative machines need to complement humans, not just imitate them. If machines imitate humans, they will have the same limitations as humans. Machine may do things faster, but they will not be more creative.

This is a big problem! Since we humans create the machines, we easily pass on our shortcomings to them. How can we circumvent our limitations to make machines that are more creative than we are?

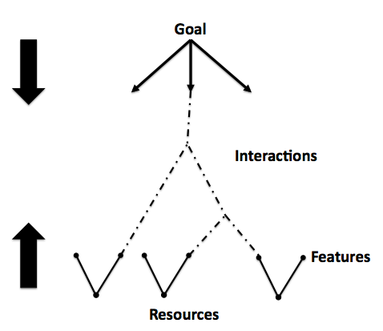
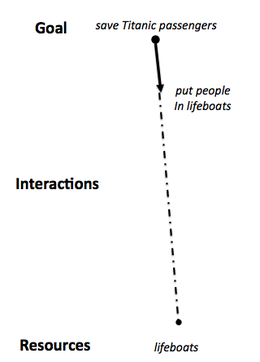
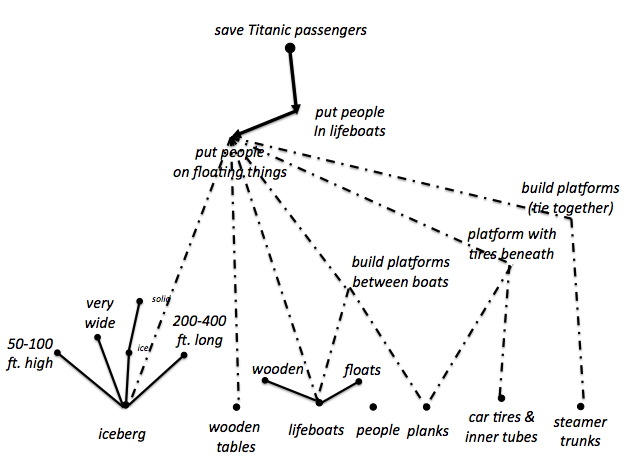
Here is the solution. Any innovative solution is built upon something that is currently being overlooked. To be helpful, machines need to notice what we humans don't notice.

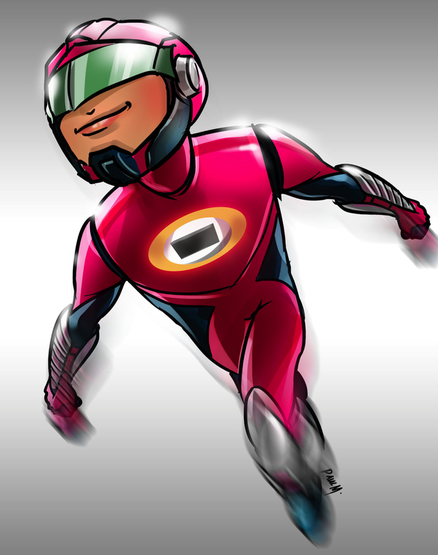
For example, a recent breakthrough in reducing concussions in football players was built upon two overlooked things about the problem.
Picture
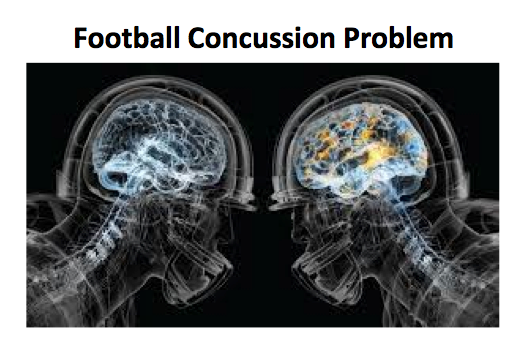
First, researchers were stuck on trying to absorb the hit of a collision. Second, they were stuck on new materials that are better at absorbing energy.

Our software rephrased the goal and then considered forces--not just materials.

Specifically, our software looked at all the synonyms and antonyms of the phrase absorb energy and uncovered ignored phrases like prevent energy and repel energy. The word repel was closely related to magnetism and soon we had an aha moment!

Magnetize all the helmets with the same pole. Helmets will try to avoid each other. They will decelerate when they get close and swerve slightly to the side. The result: a glancing blow rather than a direct collision!

Our software helped us because it 'thinks' differently than we do. If machines 'think' just like their creators, they will never help us be more creative.

If innovative solutions are built on what we overlook, then machines that can look where we don't will help us be more creative.


This software now exists! Learn more about it.


Contact Dr. Tony McCaffrey (tony@innovationaccelerator.com) to learn more about this software that looks where humans do not.


Footnote to our story: We submitted our magnet idea to the patent office and found that someone else beat us by a few weeks. Our software cannot feel disappointment and will 'gladly' help us with the next problem we give it.

The Creative Think Horizontally, Not Vertically

12/14/2014

 
When you graph it out, you will find that creative people think horizontally; others vertically.

Compare the graphs below between the crew of the Titanic and my students. The crew's graph is narrow, a typical vertical graph that shows little creativity. My students' graph, with its many ideas, is wide in the horizontal dimension.


Problem: Save the People on the Titanic

Putting people in lifeboats was the only serious solution that Titanic's crew came up with to save the people on the sinking ship. Their idea saved just 705 of the 2,228 passengers (only 32% of the passengers).

On a problem solving graph below that divides solutions into their basic components, you will see that the crew only used one resource (i.e., lifeboats) and one interaction (i.e., put people in those lifeboats) to try to achieve their goal.


It is quite a vertical graph as the human mind hastens to travel in the vertical direction to connect the goal with the resources as quickly as possible--but often not very effectively.
Picture
Narrow Graph of Titanic Crew's Idea
In contrast, note how horizontal (i.e., wide) is the graph below created by a group of my students.
Picture
Wide, Detailed Graph of Titanic Ideas
They asked a simple question about the crew's solution and quickly the graph grew quite wide.

What was important about lifeboats? They floated and were wooden.

These details about lifeboats triggered many other details about floating things.

My student group noticed that the iceberg is a floating thing that could possibly been used to keep people out of the water. They noticed wooden tables, wooden planks, steamer trunks--even car tires and inner tubes from the estimated 40 cars in storage. Each of these floating things could have been used in isolation or in combination with other floating things to keep people out of the water.


The Horizontal is the creative direction. 

We have techniques to help your team move horizontally. These techniques reveal more entries of each possible component: more ways to rephrase your goal, more resources, more features, and more interactions.


A horizontal graph is a creative graph!

Contact Dr. Tony McCaffrey (tony@innovationaccelerator.com) to start your team on the proper graphing techniques for innovation.

Autism & Creativity

12/12/2014

 
In this installment, we look to autism for hints on thinking in images; which, according to our new theory, is crucial for how the brain enacts creativity.

(First installment, Nature's 1st Aha Moment, at http://ahauniverse.weebly.com/blog/first-aha-moment)
Picture
Dr. Temple Grandin
Temple Grandin, a PhD in animal science who is also autistic.

Temple views autism “as a kind of way station on the road from animals to humans” (Animals in Translation, p. 6). Here is one example from Temple’s life that she uses to shed insight on how animals might think. One day while driving, an elk ran out in front of Temple’s car. Three images flashed into her mind representing three different possible responses. Image 1: A car rear-ending her was related to the action of slamming on her brakes. Image 2: The elk crashing through the windshield was related to the action of swerving. Image 3: The elk passing in front of her car was related to the action of just slowing down. She chose the third image—the desirable outcome—and the associated action executed to achieve the outcome. From this experience and others, Temple believes that perhaps animals can think in much the same way. 

Temple claims to think in pictures. She is also able to use words to communicate, but that is not her primary mode of thinking. When the word ‘steeple’ is spoken, for example, her inner experience is as if you typed in ‘steeple’ into Google Images. Many steeples that she has experienced stream through her mind. Temple is able to manipulate her images. For example, she can change the color of a specific steeple or transplant a specific steeple from one church building onto another. 

Temple believes that people with severe autism have no ability to manipulate their images. They are basically stuck in their perceptions (present) and memories (past) and unable to modify or generalize them. Consequently, they exhibit rigid, non-flexible, non-creative behavior.

It would seem then that animals’ sensorimotor systems might derive one or more plans and communicate the plans in mental images. One mental image might induce fear and trigger the associated action plan. Another mental image might induce desire and trigger its associated plan. In this way, cognitively sophisticated animals use their emotions to choose between options without the use of analysis or deduction. Less sophisticated animals may craft fewer plans to choose from and may have less freedom to resist responding to strong emotions. In essence, based on Temple Grandin’s experiences, the sensorimotor systems of animals are sufficient to provide the ability to choose between multiple responses.


In the next installment, we look at the neural evidence of how memory (a perceptual reconstruction) and future thinking (a perceptual construction of a possible future event) are almost neurally indistinguishable. The neural evidence will help us conclude that early problem solving in mammals is a special form of future thinking.

Direct comments and questions to Dr. Tony McCaffrey (tony@innovationaccelerator.com).

Do Crosswords in Your Head?!

12/11/2014

 
You wouldn't do a crossword puzzle in your head. There are too many constraints to remember.

Yet, why do you solve complex problems at work without a picture of all the aspects of your problem and how they all relate?
Picture
BrainSwarming Graphs were designed for just this purpose: to keep track of all the constraints and relationships of your problem. 


This aids your memory and your communication with your team.
Picture
When working on your problem, you are either refining your goal by examining constraints and assumptions, considering various resources at your disposal, analyzing resources into their features, or interacting your resources to try to make progress toward your goal.

There is a place on the graph for every type of activity and the BrainSwarming Graph shows you when you have a solution. 

When the top part of the graph connects to the bottom part, then you have a potential solution. You have found a sequence of interactions involving your resources (and their features) that accomplish your goal.

You don't have to remember all the details and constraints of your problem! It is all there in front of your eyes in one glance.

Communication among team members is easy with everything in one BrainSwarming graph.

Contact Dr. Tony McCaffrey (tony@innovationaccelerator.com) to start your team on BrainSwarming Graphs.

Captain Sideways: FAQs

12/9/2014

 
What does Captain Sideways do?
Captain Sideways solves problems by looking at things 'sideways'--from unusual perspectives.
Picture

Where did Captain Sideways come from?
The Ahaverse, short for Aha Universe, is a distant part of the universe. There, Dark Matter is prevalent. Organic life in the Ahaverse evolved to relate to regular matter differently because of being exposed to so much Dark Matter.


Is Captain Sideways human?
No. Captain Sideways resembles a 10-year-old human, but is not human. Humans would guess that Captain Sideways is male, but don't believe them.


Can Captain Sideways fly?
Because of exposure to Dark Matter in the Ahaverse, Captain Sideways (CS) floats above regular matter and is not strongly attracted to it. So, CS appears to fly above the Earth, but is really floating at a certain speed in a certain direction.

CS has to concentrate to stay on the ground. While daydreaming, CS floats away and people say that CS is "spacey."
Picture
Floating that Looks Like Flying

What is the symbol on the suit?
Picture
Symbol on Suit
You see a dark box with a lighted ring around it? This means that the light (the solution) is "outside the box." To be a creative problem solver you have to think outside the box. Captain Sideways' brain is always thinking outside the box, so Captain Sideways is good at problem solving.


What does the helmet do?
Picture
Helmet and Visor
The helmet pumps extra micro-bits of electricity into Captain Sideways' brain to keep it hyper-active. It overstimulates the brain so it is constantly making new connections.


What does the visor do?
The visor projects information that only Captain Sideways can see. A computer called C-More (See More) is constantly looking up information relevant to the problem and projecting it onto the visor so Captain Sideways can see it. C-More helps Captain Sideways to see more!

Together, Captain Sideways and C-More combine the best of organic creativity and machine creativity!!


When is the 1st comic strip due out?
It is out now! Follow the link.

http://sidewaysdiary.weebly.com/blog/1st-comic-strip


Who is the creator?
Dr. Tony McCaffrey holds a PhD in cognitive psychology and does research on new techniques to improve people's creativity and problem solving abilities. He uses Captain Sideways to teach youth proven problem solving techniques. Tony's company, Innovation Accelerator, Inc., devises software to help humans overcome their mental obstacles to innovation. C-More, Captain Sideways' visor, runs this innovation assistance software to help Captain Sideways solve problems. Tony is also the creator of BrainSwarming, which is a new group problem solving technique that is shown to work much better than brainstorming.


How do I contact Dr. Tony McCaffrey?
tony.mccaffreyphd@gmail.com


What is the focus of the Captain Sideways comic strip?
Think of it as a comic strip version of Lumosity. Instead of games and activities, go on adventures to solve real-world problems with Captain Sideways as your guide. Captain Sideways only uses proven creativity and problem solving techniques based on the latest neuroscience and cognitive psychology. 

Building a Home without a Blueprint?!

12/7/2014

 
You wouldn't build a home without a blueprint. There are too many details to keep track of.

Yet, why do you solve complex problems at work without a picture of all the aspects of your problem and how they all relate?
Picture
Home Blueprint
BrainSwarming Graphs were designed for just this purpose: to keep track of all the details and relationships of your problem in one picture.
Picture
BrainSwarming Graph
When working on your problem, you are either refining your goal by examining constraints and assumptions, considering various resources at your disposal, analyzing resources into their features, or interacting your resources to try to make progress toward your goal.

There is a place on the graph for every type of activity and the BrainSwarming Graph shows you when you have a solution. 

When the top part of the graph connects to the bottom part, then you have a potential solution. You have found a sequence of interactions involving your resources (and their features) that accomplish your goal.

You don't have to remember all the details of your problem! It is all there in front of your eyes in one glance.

You don't have to write a detailed report for your colleagues about all of your ideas. You just show them the BrainSwarming Graph and narrate briefly how all of the details so far considered fit together. They can then add their own ideas to the graph you have already built.

Contact Dr. Tony McCaffrey (tony@innovationaccelerator.com) to start your team on BrainSwarming Graphs.

You Don't Do Sudoku in your Head...

12/7/2014

 
You wouldn't do a Sudoku puzzle in your head. Without that classic 9x9 grid in front of you, there are just too many things to keep track of.
Picture
Sudoku Puzzle
The problems you solve at work are at least as complex as a Sudoku puzzle, yet you probably don't have a structured way to visualize all the aspects of your problem and their relationships?

BrainSwarming Graphs were designed for just this purpose.
Picture
BrainSwarming Graph
BrainSwarming Graphs keep track of every detail about your problem and put in its is proper place. 

When working on your problem, you are either refining your goal by examining constraints and assumptions, considering various resources at your disposal, analyzing resources into their features, or interacting your resources to try to make progress toward your goal.

There is a place on the graph for every type of activity and the BrainSwarming Graph shows you when you have a solution. 


When the top part of the graph connects to the bottom part, then you have a potential solution. You have found a sequence of interactions involving your resources (and their features) that accomplish your goal.

You don't have to remember all the details of your problem! It is all there in front of your eyes in one glance.

You don't have to write a detailed report for your colleagues about all of your ideas. You just show them the BrainSwarming Graph and narrate briefly how all of the details so far considered fit together. They can then add their own ideas to the graph you have already built.

Contact Dr. Tony McCaffrey (tony@innovationaccelerator.com) to start your team on BrainSwarming Graphs.

Overcoming Memory Limits while Problem Solving

12/6/2014

 
Your working memory cannot keep track of all the parts of the complex problems you work on. Originally, working memory was thought to be able to hold seven "chunks" of information, but more recent evidence brings that number down closer to four.

To counteract the limits of working memory, you need a visual aid to show all the parts of your problem and how they relate to each other.

BrainSwarming Graphs were designed for just this reason.
Picture
BrainSwarming Graph
As people refine the goal, the top of the graph grows downward. As people interact the resources (and their features) together, the bottom of the graph grows upward. When the two directions connect, you have your first potential solution path connecting your resources with your goal.

BrainSwarming Graphs
 record all your details in their proper place so you can see how they relate to each other. You don't have to remember all the parts and their interrelations! There are just two many to remember and the graph makes it all accessible in one glance.


In this way, a BrainSwarming Graph manages the complexity of your problem and overcomes the limits of your memory.

Contact Dr. Tony McCaffrey (tony@innovationaccelerator.com) to start your team on BrainSwarming Graphs.

Notice More, Innovative More

12/6/2014

 
The more details you notice, the more innovative solutions you'll come up with.

Noticing more details about your goal, your resources, their features, and how your resources interact all add up to creating more solutions.

After all, a solution is a sequence of interactions among your resources (and their features) that ultimately accomplish your goal.

The more details you notice, the more "raw" information you have to form solutions out of.

When you visualize all your "raw" information together on a map (or graph), you can instantly see in one glance how they all relate to each other.

Picture
Figure 1: A Problem Solving Map called a BrainSwarming Graph
Figure 1 is called a BrainSwarming graph because groups of people can work together as a "swarm" to build a graph that keeps track of all their "raw" information and how it relates to each other.

As people refine the goal, the top of the graph grows downward. As people interact the resources (and their features) together, the bottom of the graph grows upward. When the two directions connect, you have your first potential solution path connecting your resources with your goal.


Sample Problem: 
Save the People on the Titanic

Putting people in lifeboats was the only serious solution that Titanic's crew came up with to save the people on the sinking ship. Their idea saved just 705 of the 2,228 passengers (only 32% of the passengers).

On a graph, you can see that they noticed very few details. Consequently, they only came up with one solution.
Picture
Figure 2: Titanic Crew's Only Idea
They needed to notice more!

Figure 3 shows many more details about goals, resources, features, and interactions. Consequently, more possible solutions emerge!
Picture
Figure 3: Detailed Graph of Titanic Problem
What was important about lifeboats? They floated and were wooden.

These details about lifeboats triggered many other details about floating things.

My student group noticed that the iceberg is a floating thing that could possibly been used to keep people out of the water. They noticed wooden tables, wooden planks, steamer trunks--even car tires and inner tubes from the estimated 40 cars in storage. Each of these floating things could have been used in isolation or in combination with other floating things to keep people out of the water.


Solving Your Complex Problems

Your problems are most likely as complicated as the Titanic problem. Visualizing the many details of your problem and their relationships may be a matter of life and death for your company--if not literally a life and death matter.

BrainSwarming Graphs record all your details in their proper place so you can see how they relate to each other. In this way, a BrainSwarming Graph manages the complexity of your problem and reduces it to a simple and intuitive visualization. 

We have techniques to help you notice more details of each possible component: more ways to rephrase your goal, more resources, more features, and more interactions. The more you notice, the more innovative you will be!

Contact Dr. Tony McCaffrey (tony@innovationaccelerator.com) to start your team on BrainSwarming Graphs.

Your team will soon be able to visualize your complex problems more simply and create more solutions.

Seeing is Innovating!

12/6/2014

 
Picture
Seeing is Innovating
"I see the iceberg as a floating surface!" a student exclaimed as we were working on ways to save more people on the Titanic.

"I see football helmets as magnetized spheres," blurted my business partner. "I see them with the same polarity so they will want to resist contact with each other!" We later found that someone beat us to the patent office with this idea by two weeks!

Seeing is literally and metaphorically the sense we use when experiencing and describing insights.

We see new connections, new relationships, and new features. We see something as something else (e.g., an iceberg as a floating surface). 
Picture
Seeing New Connections
New research shows that seeing things abstractly in graphs improves your ability to actually see new connections, new features, and ultimately new in-sights. 

BrainSwarming graphs (see below) allow you to see your complex problem in one glance--with all of its components and relationships.
Picture
BrainSwarming: Seeing in the Abstract
Breaking down all the parts of a problem (especially your resources and features) and seeing how they relate to each other (how they interact) allows you to see more ways to solve your problem (solution paths from your goal to your resources).

Your memory cannot keep track of all your resources and their features. Your memory certainly cannot keep track of the possible relationships, connections, and interactions.


But you can see them all at once with the right graph!

The result is more in-sights and more innovation.

Seeing is more than just a metaphor for innovation. It is literally true. Seeing is innovating!


Learn how to see your problem using the right graphing method. Learn how to use these BrainSwarming graphs to increase your in-sights and your team's innovation.

Contact Dr. Tony McCaffrey to learn more and get your team seeing more innovatively: tony@innovationacclerator.com, @DrTonyMcCaffrey.
<<Previous

    RSS Feed

    Tony McCaffrey

    Innovation Researcher, College Professor, Entrepreneur

    Categories

    All
    Games
    Techniques
    Theory
    Vision

    Archives

    June 2020
    June 2017
    May 2017
    August 2015
    December 2014
    November 2014
    September 2014
    August 2014
    July 2014
    June 2014
    May 2014
    April 2014
    March 2014
    January 2014
    December 2013
    November 2013

Powered by Create your own unique website with customizable templates.