Seeing is Innovating
"I see the iceberg as a floating surface!" a student exclaimed as we were working on ways to save more people on the Titanic.
"I see football helmets as magnetized spheres," blurted my business partner. "I see them with the same polarity so they will want to resist contact with each other!" We later found that someone beat us to the patent office with this idea by two weeks!
"I see football helmets as magnetized spheres," blurted my business partner. "I see them with the same polarity so they will want to resist contact with each other!" We later found that someone beat us to the patent office with this idea by two weeks!
Seeing is literally and metaphorically the sense we use when experiencing and describing insights.
We see new connections, new relationships, and new features. We see something as something else (e.g., an iceberg as a floating surface).
We see new connections, new relationships, and new features. We see something as something else (e.g., an iceberg as a floating surface).
Seeing New Connections
New research shows that seeing things abstractly in graphs improves your ability to actually see new connections, new features, and ultimately new in-sights.
BrainSwarming graphs (see below) allow you to see your complex problem in one glance--with all of its components and relationships.
BrainSwarming graphs (see below) allow you to see your complex problem in one glance--with all of its components and relationships.
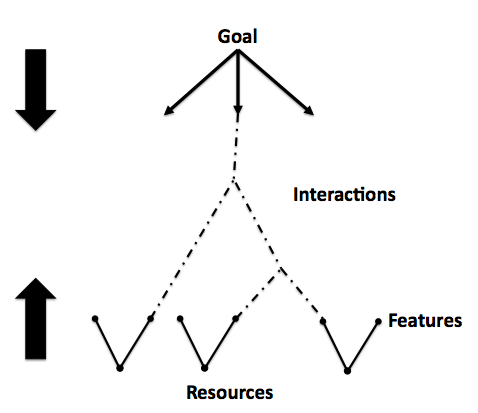
BrainSwarming: Seeing in the Abstract
Breaking down all the parts of a problem (especially your resources and features) and seeing how they relate to each other (how they interact) allows you to see more ways to solve your problem (solution paths from your goal to your resources).
Your memory cannot keep track of all your resources and their features. Your memory certainly cannot keep track of the possible relationships, connections, and interactions.
But you can see them all at once with the right graph!
The result is more in-sights and more innovation.
Seeing is more than just a metaphor for innovation. It is literally true. Seeing is innovating!
Learn how to see your problem using the right graphing method. Learn how to use these BrainSwarming graphs to increase your in-sights and your team's innovation.
Contact Dr. Tony McCaffrey to learn more and get your team seeing more innovatively: [email protected], @DrTonyMcCaffrey.
 RSS Feed
