You wouldn't play chess without a chessboard. There are just too many pieces to keep track of.
Why do you solve problems without a BrainSwarming graph to visualize all the aspects of your problem and their relationships?
Why do you solve problems without a BrainSwarming graph to visualize all the aspects of your problem and their relationships?
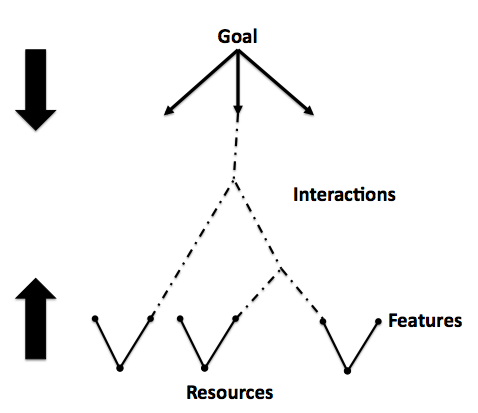
Figure 2: Components of a Problem
Just as there are different chess pieces, there are different components of a problem. A problem has a goal, which can be rephrased in many ways. A problem has resources, which you use to accomplish your goal. Each resource has features, which help you notice how to use that resource to solve your problem. Finally, a potential solution to your problem has interacted your some of your resources together to solve the problem.
When you put these four components in their proper location on a graph, you can instantly see how they all relate to each other.
When you put these four components in their proper location on a graph, you can instantly see how they all relate to each other.

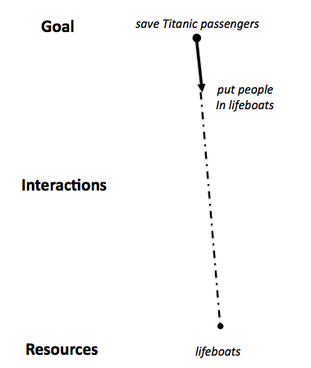
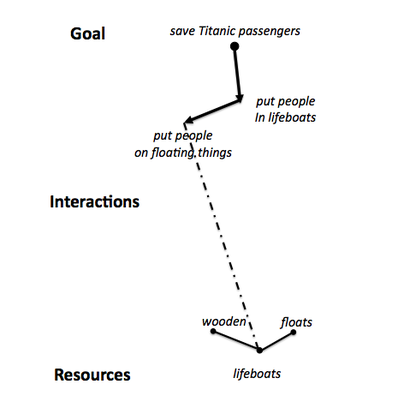
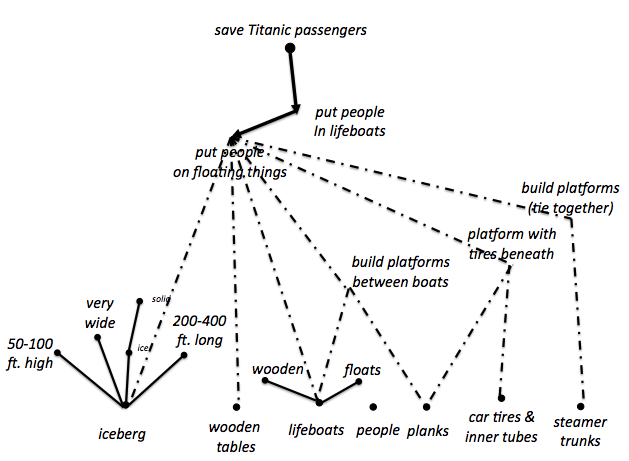
Figure 3: BrainSwarming Graph for Titanic Problem
Figure 2 is called a BrainSwarming graph because groups of people can work together as a "swarm" and build a graph that keeps track of all their ideas and how they relate to each other.
As people refine the goal, the top of the graph grows downward. As people interact the resources (and their features) together, the bottom of the graph grows upward. When the two directions connect, you have your first potential solution that shows itself as a path connecting your resources with the goal.
Sample Problem: Save the People on the Titanic
Figure 3 shows how one group created many ways to save many people on the Titanic. The original solution, put people in lifeboats, only saved 705 of the 2,228 passengers (only 32% of the passengers).
The original solution, put people in lifeboats, was rephrased in Figure 3 by describing lifeboats by their key features to create put people on floating things. Once this rephrasing occurred, then people noticed many possible resources that could help save the passengers.
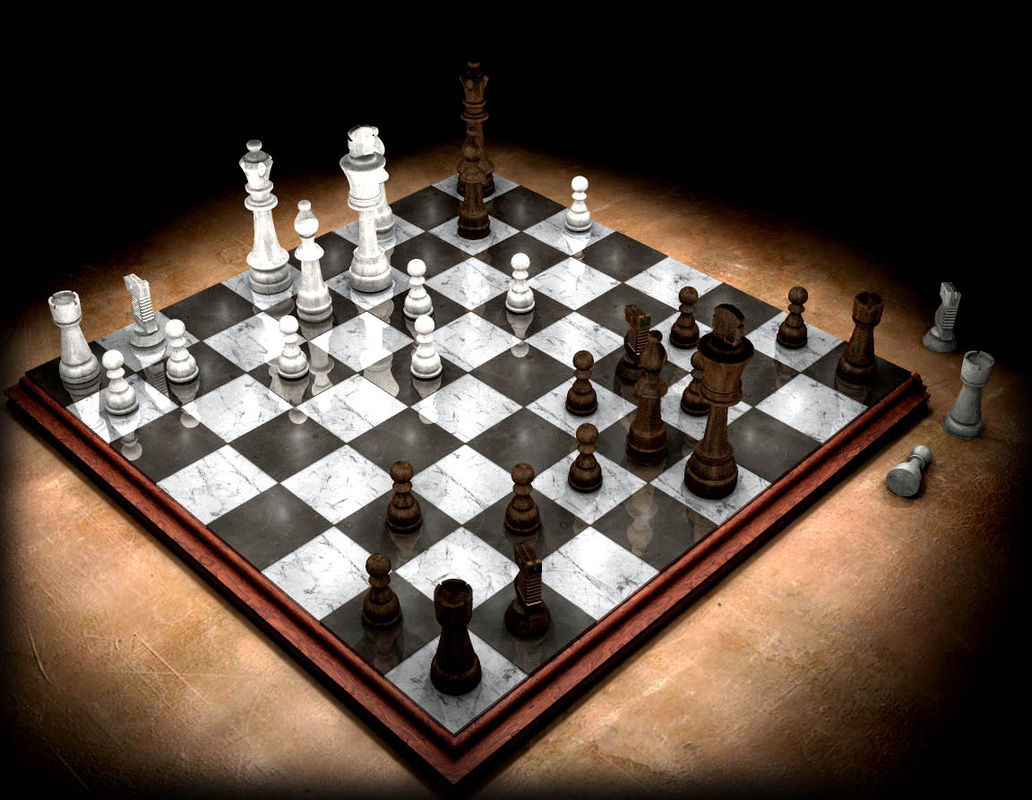
Figure 1: Chessboard
People noticed that the iceberg is a floating thing that could possibly been used to keep people out of the water. They noticed wooden tables, wooden planks, steamer trunks--even car tires and inner tubes from the estimated 40 cars in storage. Each of these floating things could have been used in isolation or in combination with other floating things to keep people out of the water.
The BrainSwarming Graph shows all these things and how they might interact with each other to help accomplish the goal. And all this came from just one way of rephrasing the goal. There are many other useful resources that we did not include in Figure 3.
Your problems are most likely as complicated as the Titanic problem. Visualizing the many components of your problem and their relationships may be a matter of life and death for your company--if not literally a life and death matter.
BrainSwarming Graphs reduce the complexity of problems to a simple and intuitive visualization method. We have techniques help you notice more of each component: more ways to rephrase your goal, more resources, more features, and more interaction. The more you notice, the more innovative you will be!
Contact Dr. Tony McCaffrey ([email protected]) to start your team on BrainSwarming Graphs.
They will be able to work together more easily, visualize your complex problems more simply, and create more solutions.

 RSS Feed
