What manager has not wished that they could measure how innovative their team members are?
With BrainSwarming graphs, it is quite easy, quantitative, and objective.
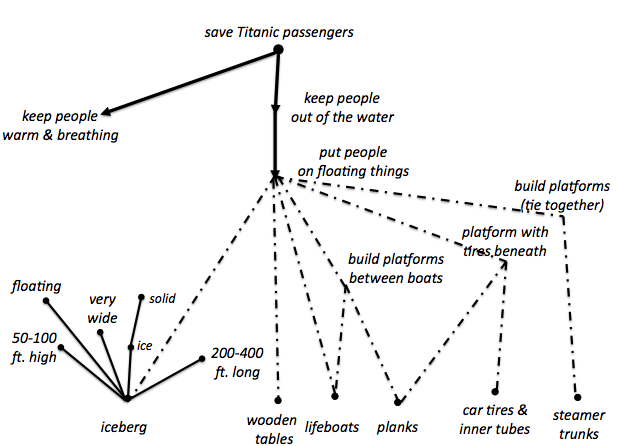
Suppose your team was working on the Titanic problem and created the BrainSwarming graph shown in the figure below.
First, I will describe the BrainSwarming graph for Titanic solutions and then show how it leads to quantitative, objective measures for each team member.
Remember that in a BrainSwarming graph the goal starts at the top: save Titanic passengers. Refinements of the goal grow downward. Resources start at the bottom: iceberg, wooden tables, lifeboats, etc. The iceberg is decomposed into features and those solid lines grow upward. Dotted lines indicates the interactions between resources. For example, it was estimated that 40 cars were being transported on the Titanic, so that means up to 160 rubber tires and 160 inner tubes--not counting spare tires. Tie the tires together in rectangular shapes to form a floating platform. Then, place wooden boards/planks on the floating tires so people can stand or sit on this make-shift raft. The dotted lines show that by interacting planks and car tires together you can make a platform with the tires beneath. This, in turn, is a way to put people on floating things--which solves the problem.
With BrainSwarming graphs, it is quite easy, quantitative, and objective.
Suppose your team was working on the Titanic problem and created the BrainSwarming graph shown in the figure below.
First, I will describe the BrainSwarming graph for Titanic solutions and then show how it leads to quantitative, objective measures for each team member.
Remember that in a BrainSwarming graph the goal starts at the top: save Titanic passengers. Refinements of the goal grow downward. Resources start at the bottom: iceberg, wooden tables, lifeboats, etc. The iceberg is decomposed into features and those solid lines grow upward. Dotted lines indicates the interactions between resources. For example, it was estimated that 40 cars were being transported on the Titanic, so that means up to 160 rubber tires and 160 inner tubes--not counting spare tires. Tie the tires together in rectangular shapes to form a floating platform. Then, place wooden boards/planks on the floating tires so people can stand or sit on this make-shift raft. The dotted lines show that by interacting planks and car tires together you can make a platform with the tires beneath. This, in turn, is a way to put people on floating things--which solves the problem.
Here's how a manager can measure the innovativeness of team members.
Suppose your team created the above BrainSwarming graph, using sticky notes and drawn lines on a big whiteboard. Ask each team member to write their initials on the back of the sticky notes they used.
After the graph is built, the manager can count up the sticky notes as follows.
1) Count up how many sticky notes were contributed by each team member. This measures the raw quantity of ideas.
2) Count up how many sticky notes from each team member were on a solution path (a path with dotted lines that connects the goal and the resources). This measures how many practical and useful ideas were created--after all, they were part of a solution.
3) Count up how many sticky notes from each team member were on the solution path that was chosen as the best by management. This measure the IT Factor. How attuned are team members with what management likes?
Although no measurement of innovation is perfect, the one proposed here certainly captures different aspects of creativity: sheer quantity, usefulness, and the It Factor.
These quantitative measures can be used both to evaluate team members and incentivize them to highly engage in solving the company's problems.
 RSS Feed
